


Unearth Hidden Wealth with Market Breadth Indicators!
As we come to terms with current conditions in the markets, many investors are wondering how to identify a potential bottom and get back into the market. In attempting to identify a possible bottom, one of the tools investors can utilize is Market Breadth Indicators. Market Breadth Indicators are tools used to gauge market sentiment and the health of the overall stock market. They measure the extent—or breadth—of participation in a market or market sector, and can be used to identify whether the stock prices are supported and indicate a potential bottom. One of the strengths of Market Breadth Indicators compared to other indicators is that they have the ability to identify weak stocks as well as strong stocks. This gives investors a better understanding of the overall market situation. An example of a Breadth Indicator is the Advance/Decline line, which is a graphical representation of the total number of stocks that are rising along with the total number that are declining. This indicator helps identify whether a broad group of stocks are participating in the market. In general, a rising Line means more stocks are increasing in value while a declining line means more stocks are falling in value. Investors use Market Breadth Indicators in combination with other indicators (including technical analysis) to have a broader view of what’s happening in the overall market. For example, while a Technical Analysis Indicator looks at the trend of individual stocks, a Breadth Indicator provides insight into the health of the broader market. So, if the market is taken as a whole, if broadly-based Breadth Indicators are exhibiting increasing buying activities, such as increasing Money Flow and increasing stocks, it could signal a market bottom. Additionally, when Breadth Indicators are showing increased selling activities, such as a decline in prices and falling stocks, investors should take caution and be careful about buying stocks during that period. Overall, Market Breadth Indicators can be a valuable tool for investors in determining the health of the market and identifying bottom areas. While this is an important tool to take into consideration, investors should always use a combination of indicators as a part of their overall investing strategy. Ultimately, by employing a well-rounded approach that combines the analysis of both technical and breadth indicators, investors may be able to identify potential buying opportunities and navigate the market with greater ease.
A Wild Ride For the Histo...
Markets don’t usually hit record highs, risk falling into bearish territory, and spring back to new highs within six months. But that’s what happened in 2025. In this special mid-year recap, Grayson Roze sits down with David Keller, CMT, to

Momentum Leaders Are Rota...
Is the market’s next surge already underway? Find out with Tom Bowley’s breakdown of where the money is flowing now and how you can get in front of it. In this video, Tom covers key moves in the major indexes, revealing strength
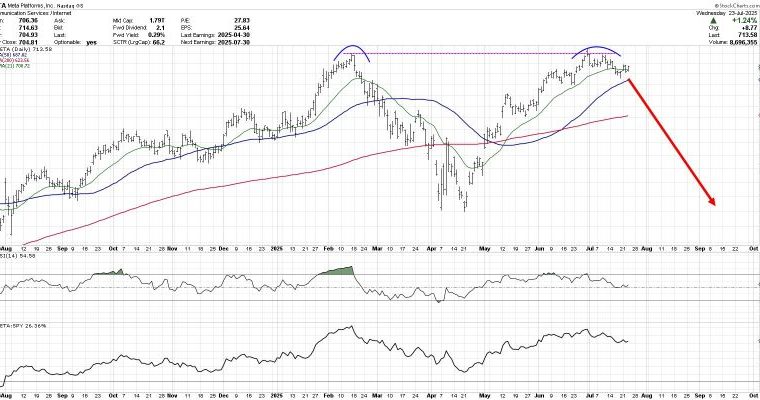
Is META Breaking Out or B...
The chart of Meta Platforms, Inc. (META) has completed a roundtrip from the February high around $740 to the April low at $480 and all the way back again. Over the last couple weeks, META has now pulled back from